How has the distribution of equivalized disposable income per person evolved using the Gini coefficient?

Further information on this indicator
-
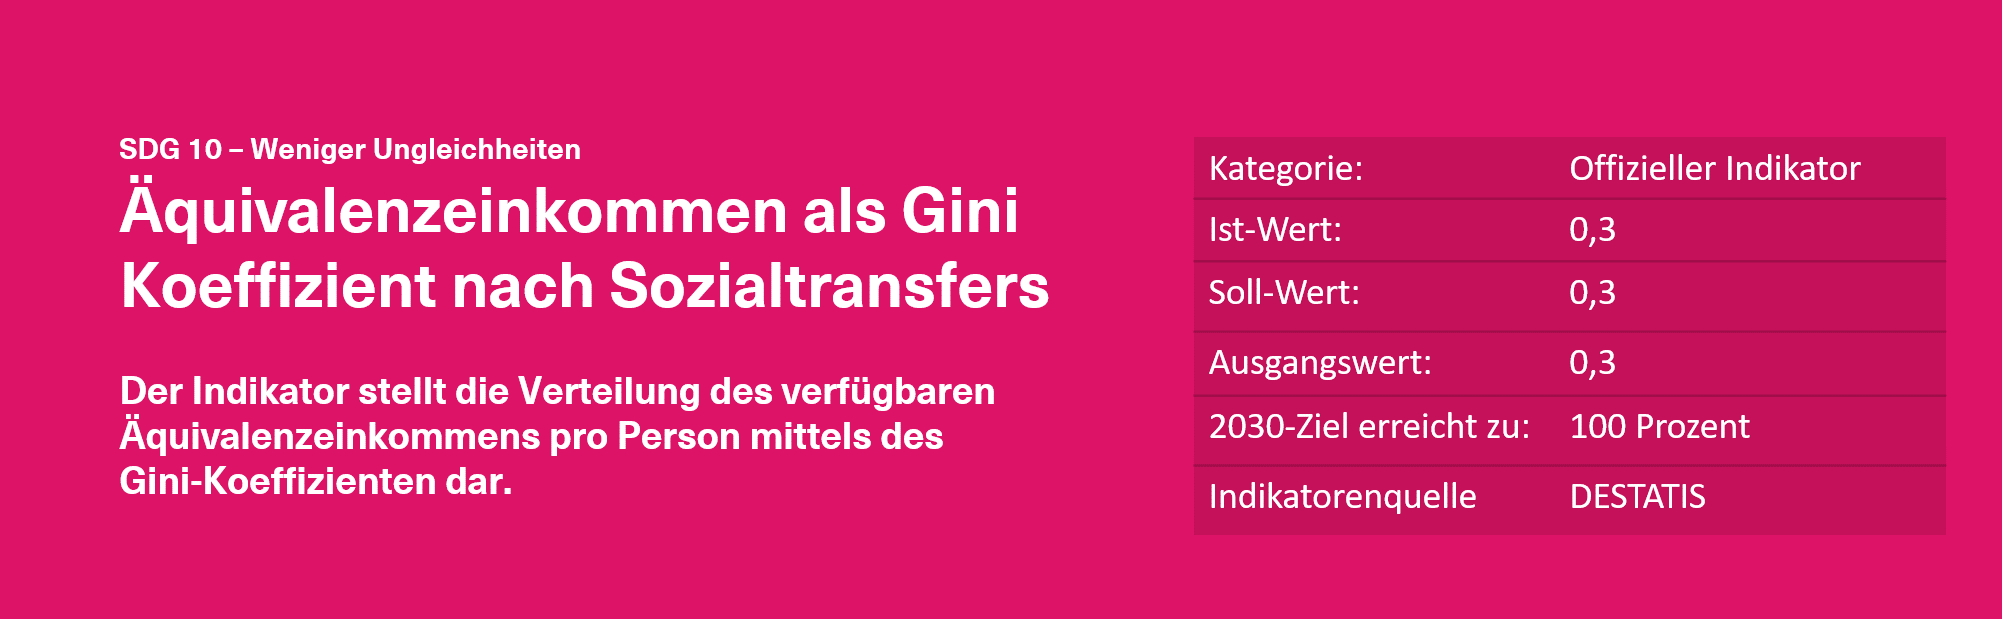
The indicator represents the distribution of equivalized disposable income per person by means of Gini coefficients. The Gini coefficient is a statistical measure of inequality in distribution. It takes a value between 0 and 1. A value of 0 means that every person has exactly the same income, while a value of 1 means that only one person receives all of the income and thus indicates the situation with maximum inequality. Equivalence income is a value derived from the total income of a household and the number and age of the persons living on this income. With the help of an equivalence scale, incomes are weighted according to household size and composition, since savings effects occur due to the shared use of living space and household appliances. Thus, a comparison of incomes is made possible regardless of household size or age of household members, since the equivalized income is assigned to each household member at the same level. Equivalized disposable income is the income, including social transfers, of a household after taxes and other deductions, and thus the income available for spending and saving. The source data on equivalized income are taken from the harmonized annual statistics on income and living conditions (EU-SILC), while the data on wealth distribution are taken from the Household Finance and Consumption Survey (HFCS), which is conducted irregularly by the European Central Bank. This method compensates for the fact that households with high incomes or large assets are underrepresented in voluntary sample surveys. As a Gini coefficient for market income is not yet calculated from EU-SILC, data from the Socio-Economic Panel (SOEP) of the German Institute for Economic Research is used for this purpose.
-
The German government's goal is for the Gini coefficient of equivalized disposable income to be below the EU average. In 2014, the Gini coefficient of equivalized disposable income for Germany was close to the value for the European Union as a whole (0.31).
-
For indicators without a set baseline by the German Sustainability Strategy, 2030Watch uses the 2008 baseline of the EU 2020 Strategy.
-
This is an official indicator of the German sustainability strategy.